
by Paolo Manasse and Giulio Trigilia
Berlusconi’s Partito della Libertà is bitterly divided as to what to do with Mario Monti. The doves (ex Christian Democrats) favour a loyal support to Monti, while the hawks (ex-socialists and ex
fascists) are crying shame for the “suspended domocracy” and the “the
bankers coup”. In order to keep his party together, Berlusconi has opted for a time-bomb strategy. Monti, he declared, has
about until June to do the (dirty) job of the necessary reforms, and then Berlusconi’s party will withdraw its
Parliamentary support. The ex Prime Minister has publicly announced a mass (anti-Monti?) party
demonstration in December, followed by the party congress in March-April,
to be followed by new elections. You guessed: Berlusconi is planning a comeback . Now, tax reform, labour
market reform, pension system reform, privatizations, cuts in the cost
of politics, liberalizations of the goods and services markets: that’s a hell of an agenda. How can anyone
think, in good faith, that 6 months can be enough for such an endevour, when Berlusconi took 9 years in power just to look after his own interests?
In
fact, markets believe otherwise.
 |
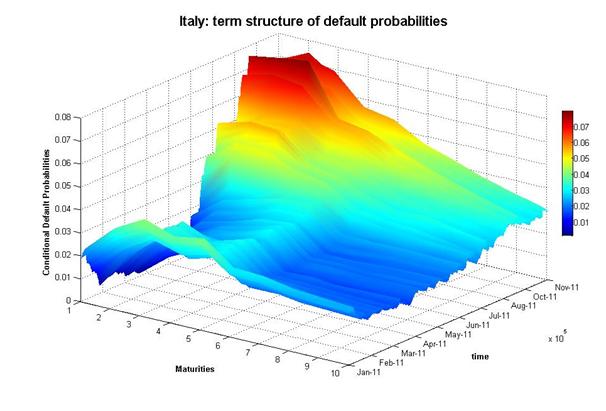
| Authors’ calculations on Data Stream data |
In the Figure above we have used the daily spreads of CDS on
the Italian debt, for maturities ranging fro1 to 10 years. Assuming a
40% recovery rate in case of default, we have calculated the implicit
probabilities of default at different maturities. The figure shows the
conditional
default probability on a contract negotiated at time t with maturity
t+T, p(t, T): This indicates the probability that a default will occurr
between time
t and t+T, conditional on not having occurred before time t. In the
figure, the vertical axis shows the probability p(t, T); the “time” axis on the right
shows
the date when the contract was negotiated t; the “maturities” axis shows the expiry
date of the contract, t+T. The picture gives two types of information. One
can fix a
maturity, say one year, and move along the time axis: this shows the
huge rise of perceived risk on the short end of the maturity spectrum
that has occurred between April and June 2011, when the default probability
climbed from below 2 to above 6%, and again from August to November
2011,
when, with the government paralyzed on budget cuts, it climbed to just below 8%.
Alternatively, one can fix a particulare contract date, say June 2011,
and look the default probabilities at different maturities. By doing so
one can see whether
the contracts negotiated at that particular date incorporate the expectation of
rising or
falling risk, as their maturities rise. What this picture clearly shows
is that, from the beginning of the year, the perceived short term riskiness on of
Italian sovereign debt has quadrupled, rising much more than at the longer horizons. Possibly more
interestingly,
the figure shows that the maturity pattern, as of late, has taken a “hill”-like shape. In other words, markets are
pricing a default
probability that first increases, for maturities of up to 2 years, but then declines progressively (conditional of no default occurring up to 2013).
What financial market are saying is that
it will take Monti at least a couple of years to go past the “harsh
times” : Will Berlusconi listen?